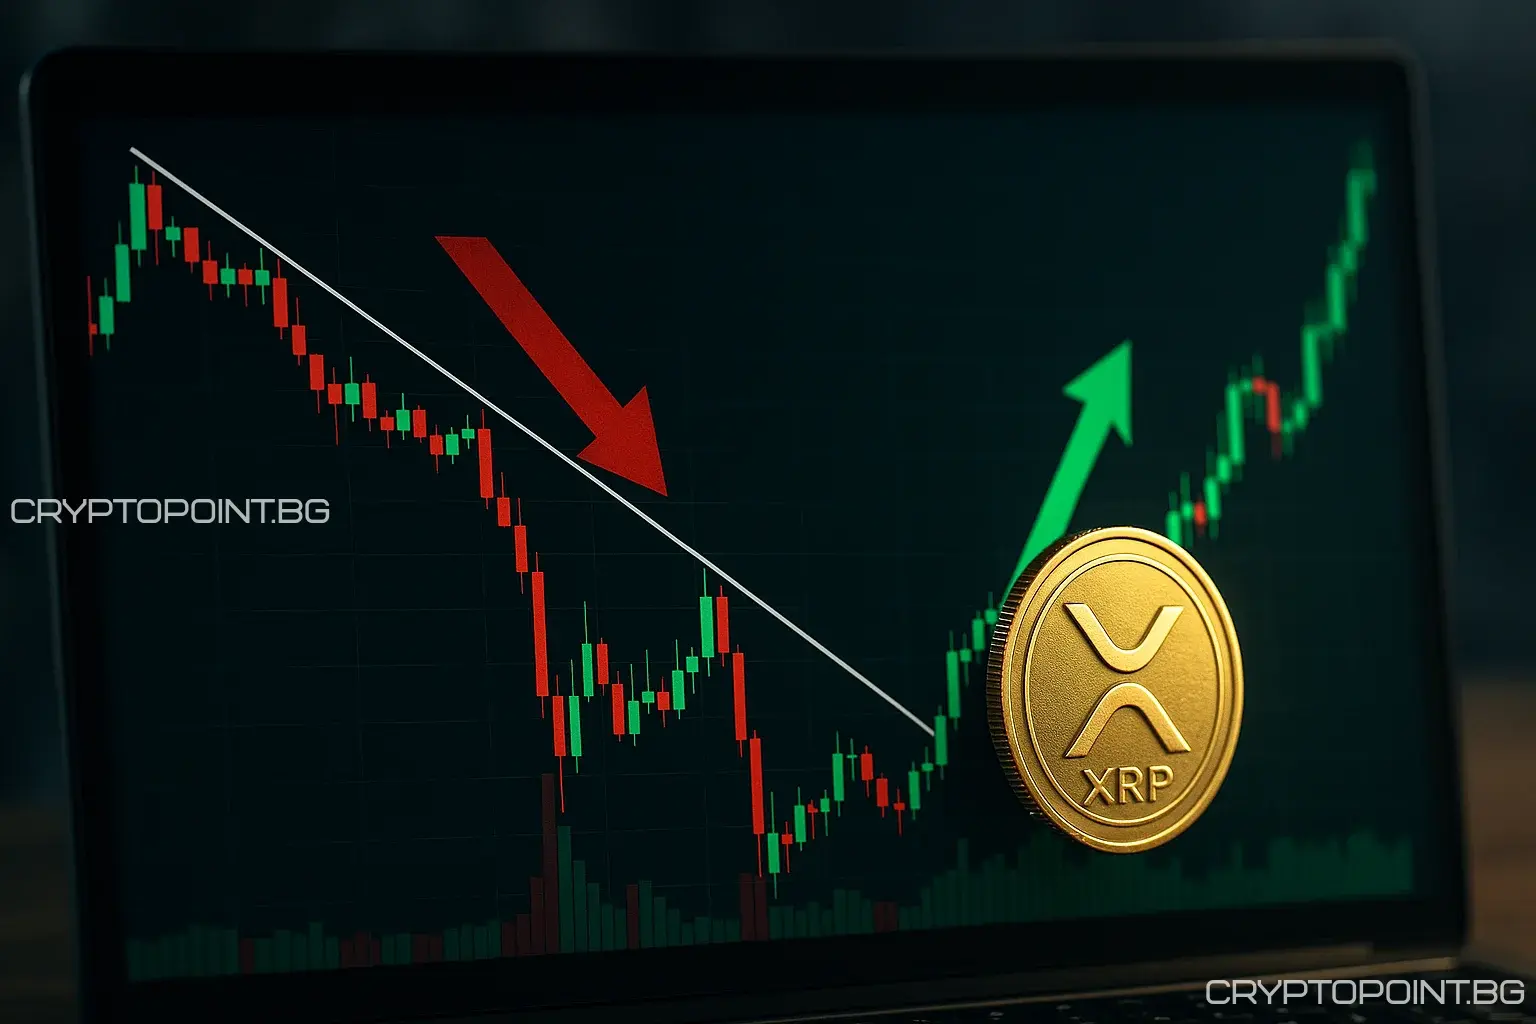
XRP, the digital asset behind the Ripple protocol, hit its lowest level since December but quickly regained ground amid rising geopolitical tensions.
XRP Confirms Bearish Analyst Forecasts
The XRP token dropped to $1.3758—a decline of over 63% from its yearly high. This triggered mass liquidations totaling $700 million.
Following the crash, XRP quickly rebounded by over 75% as investors bought the dip. This confirmed the analysis shared by Peter Brandt, who warned on social platform X:
On the left is a classic descending triangle per Edwards and Magee. On the right — one in formation. ONLY IF it closes below $2.68743 — then I expect a drop to $2.22163.
Indeed, the price hit $2.2 on Friday, as the crypto market tumbled.
Trade War Fueled the Crash
The downturn came against a backdrop of escalating U.S.–China tensions. President Trump announced a 130% tariff on Chinese imports, with China expected to respond in kind.
China’s countermeasures included:
- Banning U.S. soybean imports
- New tariffs on American ships
- Investigations into U.S. tech firms
- Export restrictions on rare earth elements
The overall crypto market lost more than $300 billion, with total market capitalization falling to $3.7 trillion. Liquidations surged to nearly $20 billion.
XRP Finds Stability—But Not Safety
Despite volatility, XRP stabilized due to:
- Significant capital inflows into ETF products
- Expectations for new spot ETF approvals
According to ETF.com, the XXRP, UXRP, and XRPR funds have all seen strong inflows since their approval.
Ripple Technical Analysis
The daily chart shows XRP peaking at $3.6553 in July before crashing to $1.3758. This decline coincided with the formation of a descending triangle—a classic bearish signal.
The crash also invalidated several bullish patterns:
- Falling wedge
- Bullish flag
- Cup and handle
XRP also broke below the 50-day and 100-day exponential moving averages.
On the upside, the formation of a large hammer candlestick—often associated with bullish trend reversals—is a positive technical indicator.
Outlook and Scenarios
The most likely scenario for XRP is high short-term volatility. The price may retest resistance at $2.70 before potentially resuming its downward trend.
Technical analysis signals both risk and opportunity—XRP remains an asset with potential, but also with high instability.
Conclusion
Ripple experienced a sharp crash followed by an unexpected rebound, driven by market panic and geopolitical developments. While short-term instability persists, ETF inflows and technical patterns suggest the possibility of a temporary stabilization.
Frequently Asked Questions
Find answers to the most common questions below.
The escalation of the U.S.–China trade war triggered widespread panic and massive crypto sell-offs.
Investors bought the dip, and inflows into XRP-related ETFs supported short-term recovery.
Overbought signals and high volatility suggest a possible retest of resistance near $2.70 before another correction.
This article is for general informational purposes only and is not intended to be, and should not be construed as, legal or investment advice. Crypto-assets are highly volatile, so only invest funds that you are willing to lose and use your own research and risk management.


