Solana (SOL) is under selling pressure, with indicators pointing to a possible 15% decline. Traders are monitoring crucial support levels for signs of a reversal.
Key Highlights
- Solana’s price has hit a critical support level; a breakdown could push it below recent lows.
- Technical and on-chain indicators support a bearish outlook, and a swift recovery seems unlikely.
Massive Divergence Between Solana’s TVL and Active Addresses
Solana has emerged as one of the top altcoins after Ethereum, especially following its historic rebound from single-digit prices. The rally that began in Q4 2024 attracted strong trader interest. However, that enthusiasm has sharply faded, possibly steering the price back to recent lows.
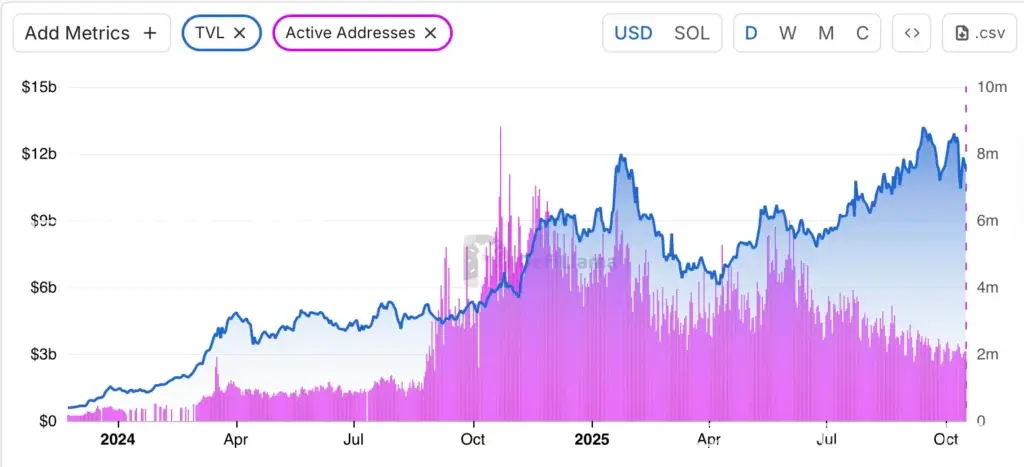
A chart from DefiLlama reveals a significant divergence between Total Value Locked (TVL) and the number of active addresses on the Solana network — a sign of unbalanced growth.

On-chain data reveals a clear drop in Solana network activity. While TVL surged from around $6 billion to over $12 billion since early 2025, active addresses fell sharply — from nearly 9 million to just 2–3 million.
This suggests that participation is declining, with capital increasingly concentrated in large holders and DeFi protocols, rather than retail users. Such divergence often precedes short-term price weakness, indicating Solana may undergo a 10–15% correction unless user engagement rebounds.
SOL Price Analysis: Will It Drop to $150 or Rebound to $220?
In recent months, Solana maintained a steady uptrend supported by rising buying interest. However, the latest pullback broke that trend and led to an intraday low below $170.
Although bulls attempted a recovery, the fear of another leg down still looms. The token could retest recent lows in the coming days.
Currently, Solana (SOL) trades around $192 after breaking below the ascending trendline — a sign of weakening bullish momentum. The 20-day EMA ($186.8) acts as immediate support, while the 50-day EMA ($199.4) and 200-day EMA ($208.7) represent resistance zones.
The Chaikin Money Flow (CMF) indicator stands at 0.11, signaling slight buying pressure but not enough to confirm a trend reversal.
A bearish breakout from a “rising wedge” pattern suggests a possible move toward $172–$165 unless SOL regains the $200 level, which could invalidate the bearish setup.
Conclusion
Solana is at a critical juncture, with both technical indicators and on-chain metrics pointing to a possible short-term correction. If network activity remains subdued and retail demand doesn’t return, a 10–15% decline is likely. However, a quick recovery above $200 could signal a trend reversal and push the price toward $220. Traders should closely watch upcoming moves and trading volume to gauge market sentiment.
Frequently Asked Questions
Find answers to the most common questions below.
Solana’s price is dropping due to weak network activity, divergence between TVL and users, and bearish technical signals.
Yes. A recovery above $200 could invalidate the current bearish outlook and indicate potential for upward momentum.
Analysts project a possible correction to $172–$165 if user engagement and price momentum continue to decline.
This article is for general informational purposes only and is not intended to be, and should not be construed as, legal or investment advice. Crypto-assets are highly volatile, so only invest funds that you are willing to lose and use your own research and risk management.


